Real data desired - case studies show how thermostats actually react
A case study makes sense when you want to offer real data to the user. A calculated formula or key points on paper always require the interpretation of an expert. However, the user often does not have time for this or lacks the expertise to interpret the data.
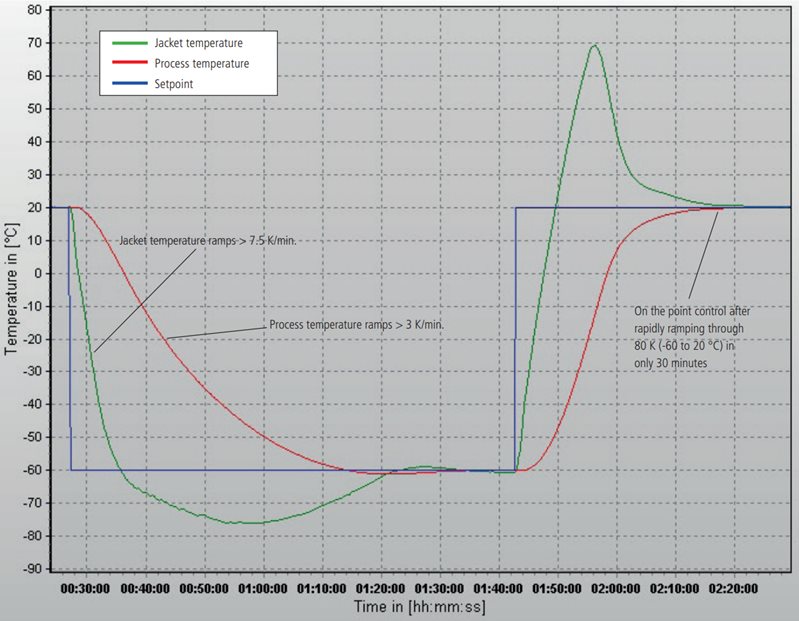
An example illustrates this: In the laboratory, there is a glass reactor with a volume of ten liters, the usable space of which is to be cooled down to -60 °C. The Unistat 910w process thermostat does this by making a setpoint jump to -60 °C (blue line in Fig. 1). The thermostat reacts with a very fast temperature drop to -60 °C, represented by the green line. The red line shows the process temperature inside the reactor. This is the information that the user needs . The goal in thermostatization is that the red curve correlates with the blue curve as quickly as possible. However, one can only transfer or extract heat if there is a temperature difference between the green and red lines. Therefore, for this case, the green line goes below the -60°C and the red process temperature comes close to the set point. This happens at one hour and 15 minutes on the time axis, which corresponds to a total duration of the cooling phase of about 45 minutes. This brings us to the area where the Unistat needs to heat up slightly, so that eventually the red process line settles on the blue line at a very small overshoot (for a volume of 7.5 l of liquid at -60 °C). Heating up from -60 °C to +20 °C takes about 30 minutes without any noticeable overshoot.
Further case studies of the Unistats with reproducible real-time data also show the less obvious effects of the respective installation such as temperature control hoses and thermal fluids in terms of dynamics and control results.
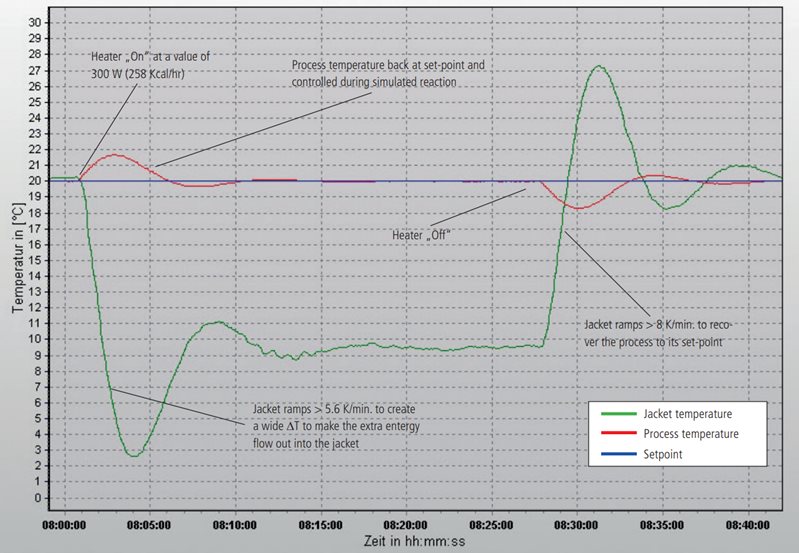
When using chemical mixing in metal/glass reactors, the problem of exothermic reactions often arises. A case study shows (see Fig. 2) how optimum cooling systems can be used to dissipate the process temperatures occurring during chemical mixing. A steel/enamel reactor with a volume of 15 liters is filled with 10 liters of silicone oil for this purpose. The Unistat 510w process thermostat is operated with DW-Therm as the thermal fluid. The resulting process heat is to be reduced, which is recorded in the graph. In the steady state of the reactor a simulated exothermic reaction with 300 W is started. The red line as the process temperature increases by about 1.7 Kelvin. The controller responds and allows the thermostat to cool to maintain the 20 °C of the blue setpoint line, which in turn can be seen on the internal green line. Now, within five minutes, the temperature drops from 20 °C to 2.5 °C. At the same time, the process temperature in the reactor is controlled to 20 °C. This brings the exotherm back under control after about ten minutes. After switching off the simulated exotherm, the endothermic reaction that has now occurred is again controlled to 20 °C after about seven minutes. This is done with an experimental duration of 17 minutes and an accuracy of less than 0.5 K. This can be reproduced with high accuracy to ensure that the application requirements are met.

The author