E-grade "Explore" for process development
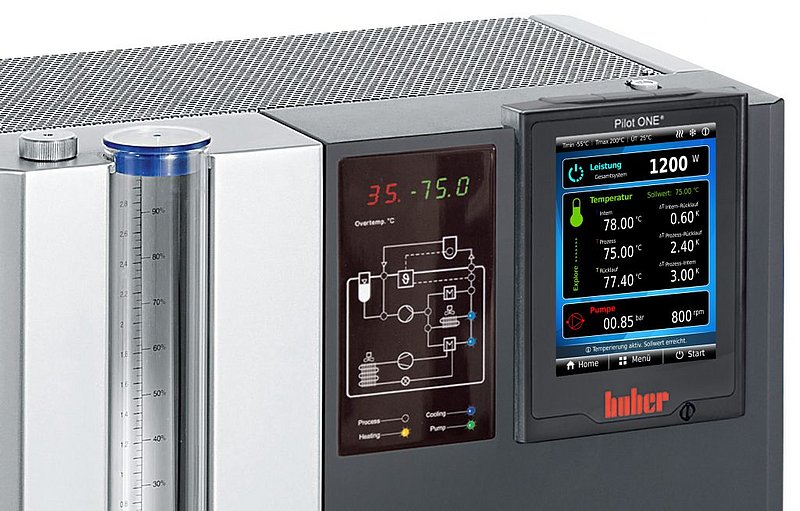
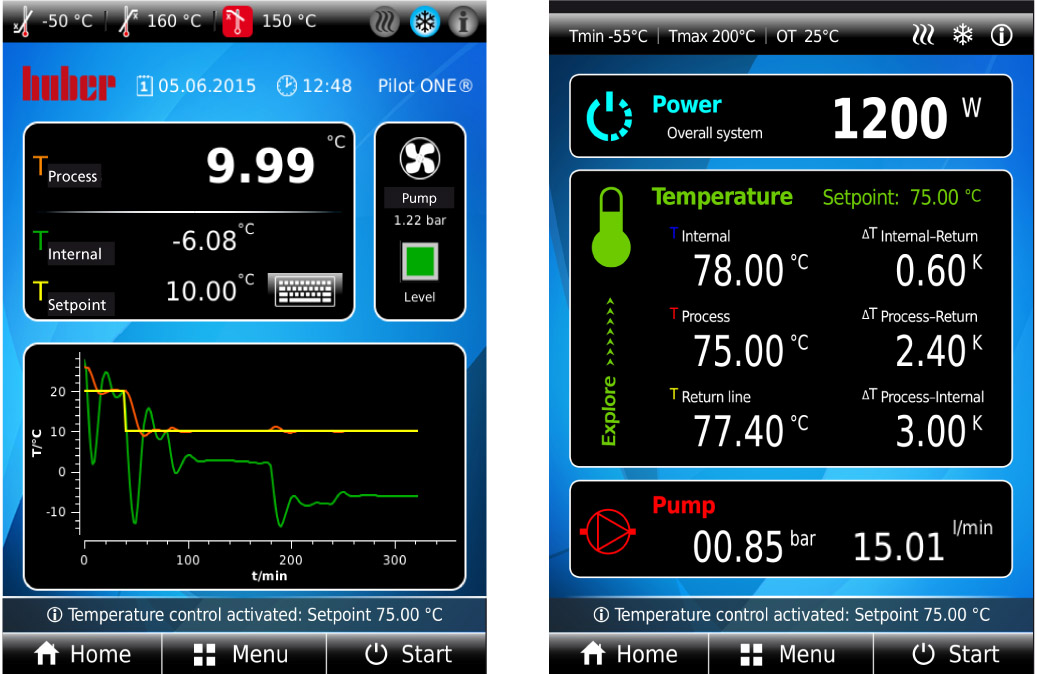
With the E-grade, the Pilot ONE gets an additional main screen for displaying the most important process data. This makes the new E-grade more than just another function package, because with E-grade "Explore" you get useful information on temperatures, heating/cooling capacity and pump capacity in the system directly on the touch panel. The E-grade "Explore" is a further development of the previous Unistat technology and uses the features of the Unistats to display important process and performance data directly on the device display. The relevant measured variables can also be further processed via the digital interfaces.
The E-grade "Explore" turns a Unistat temperature control unit into a development tool for process engineering. The advantage is obvious: you receive important information and measurement data about the process.
- Process development and optimization - Determination of thermal balances and termination criteria - Use tests of starting materials - Extended data collection for scale-up tests
In many laboratories in the chemical and pharmaceutical industries, temperature control units are used to control the temperature of double jacketed vessels. Until now, it was only possible to set a temperature setpoint and read out the jacket temperature and the process temperature. System-relevant thermodynamic data could only be accessed with additional measuring equipment. In many places, this circumstance represented an unsatisfactory work in process and process development. With the E-grade "Explore", we now offer an auxiliary tool that facilitates the work in process development.
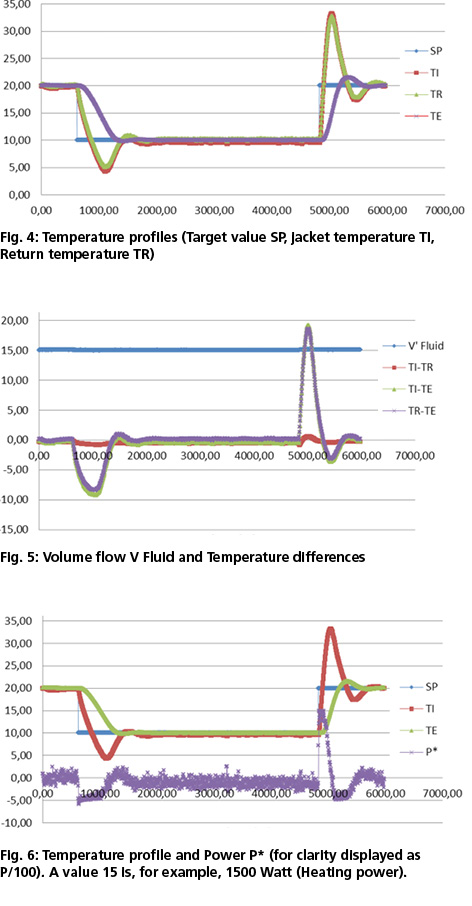
Fig. 1 shows the course of the process temperature (red) and sheath temperature (green) at different, time-constant exotherms. It can be clearly seen that exothermic reactions are regulated out in the process. The greater the exotherm, the lower the sheath temperature. The temperature difference between jacket temperature and process temperature increases. What conditions (reactor inlet temperature and reactor outlet temperature) now exist at the double jacket are unknown. Equally unknown is the information whether the temperature control unit is operating at 20%, 50% or 100% of its capacity (more precisely, cooling capacity). This is where the E-grade "Explore" comes in. The E-grade provides this system-relevant data visually and via interface. The data can be conveniently written to a USB stick in Excel format via the data logger function for further processing.
Figure 2 clearly shows the currently available power. Negative values mean cooling power and positive values mean heating power, both in watts. Also shown are the jacket temperature (reactor inlet temperature), the return temperature (reactor outlet temperature), the process temperature (reactor core temperature), the differential temperatures and optionally, when using an external flow meter, the volume flow. For the development and optimization of processes and procedures, the E-grade "Explore" improves the working conditions enormously. It is now relatively easy to document processes and procedures and to derive important findings from them. Explore" can be used, for example, to investigate how products and processes behave at different volume flows and the resulting changes in temperature values at the reactor. In a scale-down procedure, processes can be scaled down from production scale to laboratory scale. The process can then be modified, refined and optimized. Afterwards, the process is transformed back to production scale in a scale-up process. The advantages are obvious:
Process information without additional equipment - Better reproducibility - Better documentation options
Targeted process and procedure optimization - Quality improvement - Product quantity increase
Monitoring the capacity utilization of the temperature control unit - Increased planning and operating reliability
Development on a laboratory scale - Cost savings

The author